Great Australian land clearing Hoax
Compiled by David Paull [Sept 2007]
02 68424940
·
Land clearing laws have not stopped Australian land clearing as all efforts at compliance have been ineffective.
·
Official satellite monitoring figures are suspect, as monitoring systems underestimate all vegetation clearing.
·
Official clearing approvals continue at rates similar to that before the introduction of new Native Vegetation
legislation
·
Any real decrease in deforestation are more likely due to the fact that natural vegetation systems are
fast disappearing and are becoming more endangered
·
This is all in the context of global warming.
Every
year since 2002, the Federal Environment Minister has put out a press release to accompany the publication of the National
Greenhouse Gas Inventory stating that Australia
is “on track” to meet the target set under the Kyoto Protocol of an average of 108 per cent of 1990 emission levels
over the period 2008-12.
Because
of good agricultural conditions, the late 1980s and early 1990s happened to be bumper years for land clearing, particularly
in Queensland. This raised Australia’s
emissions in the Kyoto base year of 1990 by about 30 per cent,
making the 108 per cent target far cheaper and easier to achieve. Due to the Australia
clause, any reduction in land clearing could offset emission increases from burning fossil fuels.
This
is precisely what has occurred. Between 1990 and 2004, emissions from most sectors have sky-rocketed. For example, stationary
energy and transport emissions increased by 43 per cent and 23 per cent respectively. However, these increases have been offset
by a 73 per cent decline in emissions from land use change, providing an apparently respectable 2.3 per cent increase in overall
emissions.
But
has land clearing really stopped?
Latest
Figures
Queensland
Natural Resources Minister Craig Wallace said
yesterday the latest satellite figures indicated a 27 per cent cut on 2003-04 when 482,000ha was cleared and 54 per
cent lower than when clearing peaked in 1999-2000, when a whopping 758,000ha was bulldozed.
Queensland has achieved only half of its 1990 target when a million hectres were cleared.
New South Wales
DNR estimates that 30,000 hectares of native vegetation was cleared illegally in 2005. This was 40 percent
of total clearing. Last year (2006), government figures have shown there has been no decrease in these
levels of total land clearing.
DLWC/DIPNR
(now DNR) were unable to deter illegal clearing because their prosecutions under the previous NVC Act 1997 were unsuccessful
when contested. This was because of problems with meeting the evidence requirements in the NVC Act 1997 and because they were
unable to accurately detect and measure illegal clearing. DNR has only measured illegal clearing accurately for 2005, ten
years after regulation was introduced.
Approximately
74,000 hectares of native vegetation were cleared in 2005, made up of 44,000 hectares approved clearing and 30,000 hectares
illegal clearing. Most of the illegal clearing was on the previously uncleared western edge of farmland in the State.
DLWC/DIPNR
(now DNR) undertook only a small number of prosecutions in the period 1998 to 2005. No prosecutions were successful when contested
in court.
An
improved satellite system is supplying high resolution images to monitor compliance and to support prosecutions. But there
has not yet been sufficient funding to provide adequate coverage of all areas of interest in NSW.
The Stern Review estimated the global social cost from global warming through carbon
dioxide emissions at $110 per tonne of carbon dioxide today. At this price landclearing in NSW alone is costing the globe
$1.2 billion every year. Nationally Australian land clearing inflicts global costs of $ 6.4 billion annually.
Land clearing laws in NSW were activated at the end of 2005. The major gap was a compliance
policy and it was only some months later that the Minister and Department promulgated one. To date the laws have significantly
limited broadscale clearing of remnant vegetation and many millions of dollars have been disbursed to farmers for environmental
restoration works.
New South Wales has only achieved a 30% reduction of its 1990 levels. This occurred after the 1997 legislation.
There has been no decrease since the new Native Vegetation legislation of 2005.
Tasmania
It’s official. Over 50,000 hectares of Tasmania’s
native forests were approved for clearing in the last three years. 75% of Forestry Tasmania’s logging consists of clearfelling
and burning. And last year, over 13,000 hectares of native forest were converted to plantations.
The damning figures are contained in the 1999-2000 Annual Report of the Forest Practices Board, tabled in
Parliament on Tuesday by Forests Minister Paul Lennon.
The Wilderness Society’s Campaign Coordinator, Geoff Law, said the Board’s report backs Wilderness
Society warnings about the extent of forest destruction in Tasmania,
and on several key points, it contradicts Forestry Tasmania’s false reassurances.
“The official figures prove that Tasmania’s
forests are being destroyed and replaced by plantations at a horrific rate,” Mr Law said. “In three years, the
Government approved the destruction of 25,000 football fields of native forest.”
“This does not count other forests that have been clearfelled, burnt and supposedly grown back
again.”
|
Area of forest cleared for plantation or agriculture since 1996 (clearfelling followed by regeneration not counted) |
50,831 ha |
|
Area of native forest replaced by plantations in 1999-2000 |
13,400 ha |
|
Total area logged in 1999-2000 (including selective logging) |
35,100 ha |
|
Area of public native forest logged in 1999-2000 |
14,300 |
|
Area of private native forest logged in 1999-2000 |
20,800 |
|
Percentage of Forestry Tasmania’s logging that is clearfelling |
75% |
|
Total area of new plantations 1999-2000 (includes farmland) |
23,700 ha |
First published in Australian R&D Review on February 28, 2007. It is republished in collaboration with ScienceAlert, the only news website dedicated to Australasian science.
Given
the importance of land clearing in Australia’s
greenhouse accounts, it is vital that there is an accurate and transparent system for accounting for land use change emissions.
To perform this task, the Federal Government established the National Carbon Accounting System (NCAS), which relies on satellite
data to track trends in land clearing.
In
order to evaluate the reliability of NCAS outputs, the Australia Institute recently attempted a comparison between NCAS land
clearing data and the data generated by the Statewide Landcover and Trees Study (SLATS) run by the Queensland Government.
Like NCAS, SLATS tracks land clearing in Queensland using
satellite data.
Despite
the similarities between the projects, we found significant differences in the estimates of land clearing in Queensland. The SLATS estimate of clearing between 1990 and 2001 is approximately 50 per
cent higher than the NCAS estimate. In individual years the SLATS estimates are up to 164 per cent higher. Most alarmingly,
there are significant differences in the trends, with NCAS showing a steady decline in clearing, while SLATS suggests clearing
was high in the early 1990s, fell in the mid-1990s and then spiked again in the late 1990s and early 2000s.
We
investigated whether the variation in results could be explained by legitimate differences in method. The most important issue
appears to be that NCAS and SLATS have different definitions of what constitutes land clearing.
NCAS
only counts clearing of so-called “Kyoto forests”
- roughly vegetation covering at least 0.2 hectares with greater than 20 per cent crown cover and the potential to reach two
or more metres in height.
In
contrast, SLATS defines land clearing more broadly as the removal of any perennial woody vegetation that can be identified
by satellite, which roughly equates to vegetation with 16 per cent crown cover.
Using
adjusted SLATS data, we sought to account for these definitional issues, but found that large differences remained. The SLATS
clearing estimates were still significantly higher than the NCAS estimates and SLATS continued to show a spike in clearing
in the late 1990s and early 2000s that was not evident in the NCAS data.
Not
only were we unable to explain the differences between the Federal and Queensland
land clearing estimates, but when we looked at the NCAS outputs since 2002 we found large fluctuations in its own data. For
example, the estimated rate of clearing in 1990 that was published in 2005 was 46 per cent higher than the estimate published
in 2002. Of course, the upward adjustment of the 1990 clearing estimate has made it easier for Australia
to meet its Kyoto target.
The
Government dismissed the Institute’s report, claiming we don’t understand the Kyoto
accounting rules and didn’t make adjustments for differences in methods.
These
claims are false (and are addressed in a paper available on the Institute’s website). Even if they were correct, the
fact remains that NCAS is a black box: its data are not available to members of the public and are not subject to regular,
independent scrutiny.
To
ensure the integrity of Australia’s
greenhouse accounts, there needs to be an independent review of NCAS and the entire system must be made more transparent.
If this doesn’t occur, doubts will continue to linger over Australia’s
claims about its superior greenhouse performance.
New data reveal Australian Landclearing rates 22% worse than
officially recognised
New research from NSW and Queensland
has found that Australia’s landclearing
rates are much higher than previously estimated.
The independent research, completed by the Queensland Herbarium,
the NSW Royal
Botanic Gardens and the NSW
National Parks and Wildlife Service, finds the true rates of clearing are much higher
than previous estimates in Queensland and New South
Wales.
Queensland and New South Wales account for more
than 80% of the native bush
cleared in Australia.
The research indicates that Australia is clearing 687,800 hectares (6,878 square
kilometres) of native vegetation every year. Approximately two
thirds of this is virgin
bushland. This is higher by 22% than the earlier estimates of
564,800 hectares being
cleared annually. This means that over 50 “football fields”
of Australian native trees,
wildflowers and wildlife habitat are destroyed every hour.
The new studies in both states used more accurate measures of
bushland loss by
assessing the loss of trees and understorey plants such
as wildflowers and shrubs. The
previous assessments had only measured loss of trees from satellite
images. That
method greatly underestimates the true loss of native vegetation
which includes
sparsely treed open woodlands, native grasslands, herb-fields
and wetlands.
On these figures, A ustralia now ranks number five in the world
in land clearing rates,
behind the developing nations of Brazil,
Indonesia, Sudan and
Zambia.
Previously Australia
was ranked sixth behind Mexico.
The new studies also found that many of the bushland vegetation
communities that are being cleared are already amongst the most rare and threatened types of bush within NSW and Queensland.
Details of New Data
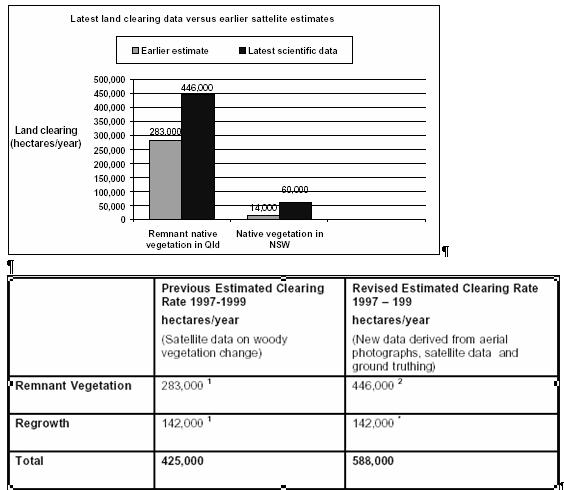
Queensland
Previous estimates of land clearing in Queensland were created by satellite surveys.
The “Statewide Landcover and Trees Study” (SLATS)
estimated change in native tree
cover (woody vegetation) at 425,000 hectares per annum between
1997 and 19991. Of
this, two thirds (283,000 hectares) was estimated to be remnant
(“virgin” or previously uncleared bushland) and one third was “regrowth” bushland (142,000 hectares).
The new research by the Queensland Herbarium used field observations,
site data,
aerial photography and satellite imagery to determine the real
clearing rate of all types
of native vegetation, not just tree cover, of 446,000ha/year
of remnant vegetation2.
Regrowth vegetation was not assessed in the new study. If the
conservative figure of
142,000 hectares of regrowth native vegetation from previous
satellite work is added,
this indicates an annual clearing rate in Queensland for the 1997-99 period of
588,000 hectares annually.
New South Wales
New studies by the Royal Botanic Gardens 3 and the NSW Parks and Wildlife
Service 4,5 indicate that the NSW land clearing rate is far greater than the previous estimates
reported by the State Government.3
Previous official estimates of landclearing have been made by
the Government
consultants Environmental Research and Information Consortium
Pty Ltd (ERIC), using satellite remote sensing. The ERIC report in 2001 estimated a relatively low annual clearing rate for
1997-2000 of 14,000 hectares6. This assessment was widely criticized by scientists and conservationists as greatly under-estimating
clearing because it only assessed more densely treed areas that had more than 20% tree cover.
Clearing of native grasslands and open woodlands was not included.
However, more thorough assessments of the real clearing rate were not available until now.
Recent studies by the NSW
Parks and Wildlife Service, measured the loss of all types
of native vegetation using field work, aerial photography and
satellite imagery 4,5. The
research particularly focused on clearing in the central and
northern wheatbelt areas
where most NSW clearing occurs. John Benson, Senior Ecologist
with the Royal
Botanic Gardens used the new data to more accurately assess the
statewide clearing
Rates.
This work conservatively estimated that 60,000 hectares is being
cleared per annum in
NSW. This is more than a four-fold increase on the official NSW
Government figure of14,000 hectares per annum.
Post
script - Clearing still continues without any restraint
Some farmers across eastern Australia
are chopping down trees to protest against land clearing laws.
The Australian Beef Association says the action involves about 2,000 farmers from Queensland,
New South Wales, Victoria and South Australia.
Chairman Brad Bellinger says they will keep felling trees until governments meet their demands.
"First day, Sunday we chopped down one tree, second day Monday, we chopped down two trees and so on until
we get some action from either Premier Beattie or Morris Iemma to do something about this ridiculous native vegetation act.
"We know the Australian Government is benefiting from collecting carbon credits, now we want payment for
what we're doing for the country or we want the native vegetation act removed."
Mr Bellinger says they need compensation or the vegetation laws must change.
Latest
official figures
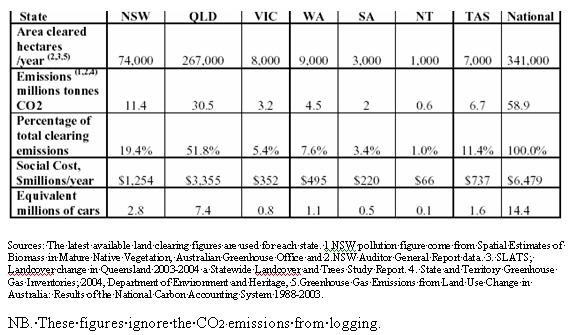
NB. These figures ignore the CO2
emissions from logging.
References
1 Department
of Natural Resources (2000) "Land Cover Change in Queensland
1997-1999" A Statewide Landcover
and Trees Study Report Issued September 2000, Indooroopilly, Qld.
2 Queensland Herbarium (2001) Remnant
Vegetation in Queensland, Analysis of Pre-clearing Remnant
1997-1999
Regional Ecosystem Information,Toowong Queensland.
3 Benson,
J.S. (2001) Clearing rates in NSW - the full picture. Hunter Flora 6: 4-5 Hunter Catchment Management
Trust: Paterson
NSW
4 Cox,
S, Sivertsen, D, & Bedward, M. (2001). Clearing in the NSW northern wheatbelt. Cunninghamia 7(1):101-
154.
5.
Bedward, M. Sivertsen, D, Metcalfe, L, Cox, S & Simpson, C. (2001). Monitoring the rate of native woody
vegetation change in the NSW wheatbelt. Final Project Report to the Natural
Heritage Trust/Environment Australia
(NPWS Sydney).
6. Environmental Research and Information Consortium Pty. Ltd. (2001) Rates
of Clearing of Native Woody
Vegetation 1997-2000. Report for the NSW Department of Land and Water Conservation (ERIC: Canberra).
7. Australian Conservation Foundation (2001). Australian land clearing, a
global perspective, latest facts and figures.
ACF, Fitzroy,
Victoria.
CLEARING OF NATIVE WOODY VEGETATION
IN
THE NEW SOUTH WALES NORTHERN WHEATBELT: EXTENT, RATE OF LOSS AND IMPLICATIONS FOR BIODIVERSITY
CONSERVATION
Stephen J. Cox, Dominic P.
Silvertsen and Michael Bedward*
Cunninghamia 7 (1): 101-155
* NSW NPWS Hurstville
From the Abstract: (bold
emphasis added)
Clearing of native woody vegetation between 1985
and 2000 in the northern wheatbelt of NSW has been mapped in detail. Intensive visual interpretation of
Landsat imagery, not automatic computer interpretation, was combined with very detailed aerial photo interpretation and ground
surveys.
“Comparisons with previously published mapping…showed
that our intensive visual interpretation detected substantially more clearing. Average annual clearing
rates were 8 times higher than those derived from the previous mapping.”
“Over 110,000 hectares of native woody vegetation were cleared between 1985
and 2000. Clearing rates were highest in the four year monitoring
period that preceded the introduction of the Native Vegetation Conservation Act.”
Introduction
Most of the original temperate woodlands in the
wheatbelt of central NSW have been cleared for agriculture over the last 200 years. SEPP 46 on the protection
and management of native vegetation was replaced by the Native Vegetation Conservation Act which began operation in
1998. Clearing and fragmentation of native vegetation was listed on a preliminary basis in 2001 as a Key
Threatening Process under the NSW Threatened Species Act. Considering all of the above, it is alarming
that there is little reliable, fine scale information available on the distribution and extent of clearing in central NSW.
Automated classification and interpretation of
satellite data covering the period 1991-1995 has been used nationally to assess clearing this national study was confined
to areas with a tree canopy cover of at least 20% which excluded large areas of woodland and shrubland. A
second study for the NSW Department of Land & Water Conservation in 1998 claimed to detect changes to areas with at a
12 – 15% canopy cover. This study detected more clearing than the totally automated study.
Ideally clearing studies should consider areas with more than 5% canopy cover.
This study considers areas with more than 5% tree
cover in the NSW northern wheatbelt. The area is north of Narrabri, and extends from Walgett to the Queensland border including the towns of Moree and Collarenebri.
The total area is about 2.4 million hectares, and includes parts of the MacIntyre-Barwon and Gwydir river systems.
Most of the land is privately owned. Crown
Land accounts for only 5% of the area, and five small nature reserves
occupy 0.05% of the area. There are no State Forests in the area. The Moree area had
the highest wheat yield per hectare in NSW for the 1997-98 crop.
The area was once part of the continuous belt
of temperate woodlands that extended from Queensland to Victoria.
Woodlands included River Red Gum, Coolabah, Black Box and Brigalow. Other woodlands included Poplar Box, White Cypress
Pine, Belah, Myall, and Ironbark. There were also extensive lignum shrublands, wetlands and native grasslands.
Results
The extent of native woodland vegetation in 1994,
1998 and 2000 was compared with baseline data from 1985 aerial photographs. Checking the 1996 satellite
imagery against detailed aerial photographs showed that the detailed manual interpretation of the satellite data 56 out of
60 randomly selected cleared areas, and 99 out of 100 randomly selected unaffected areas.
Over 110,000 hectares of native woody vegetation
were cleared between 1985 and 2000, or 16% of the vegetation remaining in 1985. The highest rate, over
100,000 ha/year was in the period ending 1998. The vegetation has become increasingly fragmented.
The number of vegetation patches rose from 535 to 684 and the average size dropped from 141 ha to 95 ha.
Particularly large areas were cleared east of Collarenebri and Mungindi. Northeast of Moree, where
native woody vegetation was already highly depleted in 1985, further clearing resulted in losses of over 40%.
Discussion
Native vegetation clearance is the single greatest
threat to terrestrial biodiversity in NSW according to the NSW
EPA State of the Environment
report. Future agricultural production and incomes are also affected by the resultant soil erosion, salinity,
loss of insect pollinators etc.
Mapping in 1998 (the ERIC study) identified an
average annual clearing rate of 1357 ha from 1995 to 1997. This study found an average clearing rate of
10,694 ha from 1994 to 1998. This is about eight times the rate quoted by the ERIC study. “Given
the demonstrated accuracy of our visual interpretation methods, the extent, and hence the rate of clearing reported by ERIC
is clearly a significant underestimate for the study area.”
In the most highly depleted bioregion, the “Northern
Outwash”, the clearing rate steadily increased over the study period despite the province having only 8% native woody
vegetation cover in 1985
“These results are alarming, but we stress
that they are conservative and the actual magnitude of loss and degradation of native vegetation in the study area is certainly
greater than that presented here for a number if reasons.”
“Accurate data on vegetation change are
essential for landuse planning. The use of methods that seriously underestimate the rate of clearing in
sparse vegetation, such as the open woodlands of the study area, risks inappropriate decision making and unforeseen negative
consequences, both for nature conservation and for sustainable agricultural production. Though it is possible
that future advances in digital analysis of satellite data will make automated methods feasible, this does not appear to be
the case at present.”
“Coolabah dominated woodlands were particularly
heavily cleared during the study period. Large stands of Coolabah had been cleared prior to this study
and others were apparently killed by altered flooding regimes in the Gwydir valley. The present rates of
decline are thus of serious concern and, if maintained, would be expected to lead to population decline in a wide range of
species.”
“Thus far, the Native Vegetation Conservation
Act, as well as State Environmental Planning Policy No. 46 that preceded it, appear to have failed to prevent further decline
in this very extensively cleared province.”
Compliance
in New South Wales
One
successful prosecutions since 1997 as all were dropped or successfully challenged.
Native
Vegetation Conservation Act 1997 compliance statistics
Table 1 – Total number of cases for each region with a ‘Compliance
Action’ outcome during the period 1 July 2002 until 29 June 2004 – NVC Act cases only
|
Compliance Action Outcome |
Barwon |
Central West |
Far West |
Hunter |
Murray/
Murrum’gee |
North Coast |
Syd South Coast |
Totals |
|
Warning Letter |
38 |
32 |
2 |
97 |
29 |
9 |
17 |
224 |
|
Stop Work Order |
9 |
1 |
- |
2 |
3 |
1 |
- |
16 |
|
Remediation Agreement |
- |
4 |
2 |
8 |
7 |
- |
10 |
31 |
|
Remediation Notice |
10 |
1 |
1 |
14 |
6 |
8 |
2 |
42 |
|
Prosecution |
4 |
2 |
- |
1 |
1 |
2 |
- |
10 |
|
Prosecution commenced |
1 |
- |
- |
1 |
- |
- |
- |
2 |
|
Remediation (Pt
5A NVCA) |
1 |
2 |
- |
1 |
2 |
- |
- |
6 |
|
Totals |
63 |
42 |
5 |
124 |
48 |
20 |
29 |
331 |
Note: there can be more than 1 compliance action for a case
Table 2 – Total number of cases for each region with a ‘No Compliance
Action’ outcome during the period 1 July 2002 until 29 June 2004 – NVC Act cases only
|
Non Compliance Action Outcome |
Barwon |
Central West |
Far West |
Hunter |
Murray/
Murrum’gee |
North Coast |
Syd South Coast |
Totals |
|
Advisory letter |
10 |
14 |
2 |
61 |
9 |
4 |
13 |
113 |
|
Authorised |
4 |
- |
3 |
4 |
1 |
4 |
5 |
21 |
|
Decided not to pursue |
59 |
15 |
7 |
29 |
18 |
2 |
20 |
150 |
|
Exclusion |
6 |
- |
1 |
10 |
3 |
3 |
10 |
33 |
|
Exemption |
87 |
26 |
6 |
133 |
30 |
42 |
90 |
414 |
|
No Clearing/Works |
26 |
1 |
- |
6 |
6 |
5 |
3 |
47 |
|
Not under Act |
5 |
2 |
10 |
10 |
6 |
- |
7 |
40 |
|
Actioned by other
Agency |
1 |
- |
- |
3 |
1 |
1 |
7 |
13 |
|
Totals |
198 |
58 |
29 |
256 |
74 |
61 |
155 |
831 |
|
|
|
|
|
|
|
|
|
|
Explanatory notes
prepared by Scott King, EDO
Warning letter
Non-statutory letter sent to landholders for breaches considered
to be of a minor or “technical nature”. Such breaches typically include clearing just beyond what is allowed by
the exemptions, or what might be allowed by creative interpretations of the exemptions.
Warning letters are also used as a case-management prioritisation
tool — that is, if a region has a heavy case load, less serious breaches may be dealt with by a warning letter (for
some regions such “less serious” cases might be clearing up to about 10 ha, or even more).
The letter advises the recipient that they have breached the
NVC Act but the Dept has chosen not to take further action, and to contact DIPNR before undertaking any further clearing.
Stop work order
The use of section 46 stop work orders was halted by many regions
when a judgement was received for one of the Greentree matters, ruling that a stop work order could not stop a landholder
clearing if they claimed to be using the exemptions, whether they actually were or not.
Remediation agreement
A non-statutory agreement with a landholder to remediate land
they have cleared. These were initially quite popular in the Dept as they were seen to be less heavy-handed than a section
47 remedial direction. However, most regions stopped using them because of their lack of power — if a landholder reneged
on the agreement, no action could be taken, and a section 47 direction would then have to be prepared and issued. It is more
efficient to just issue a s 47 direction.
Remediation notice
This is a section 47 remedial direction. Many of the older notices
contain conditions that are unenforceable, and many that were issued last year have been appealed.
Prosecution
One successful prosecutions since 1997 as all were dropped or successfully challenged.
Prosecution commenced
I assume these are new prosecutions that have been launched within
the period July 2002 to June 2004.
Remediation (Pt 5A NVCA)
These are property agreements. The use of these as a compliance
action has been stopped, because it was thought they should be used for voluntary agreements, and the landholders
under investigation for illegal clearing would be acting under duress. It was also thought they should be used if incentive
payments were available, and such a use would be inappropriate if a landholder had cleared illegally.
Table 2 shows the outcomes for investigations where it was decided
not to take any compliance action.
Advisory letter
These are issued if it is determined on a site inspection that
the clearing is within the exemptions. It is a courtesy letter that describes the findings of the visit and reminds the landholders
of the need to obtain consent for clearing beyond the exemptions.
Authorised
There was a valid development consent for the clearing.
Decided not to pursue
There can be a number of reasons for deciding not to pursue:
the clearing occurred too long ago; the regions case-load is too great; adequate evidence cannot be collected; political pressure
etc.
Exclusion
Case not pursued because either the land was excluded from the
NVC Act (section 9) or the type of clearing was excluded (section 12).
Exemption
Clearing found to be within the exemptions.
No clearing/works
No clearing was found on the property during the site inspection.
Not under Act
This would be such things as clearing non-native vegetation on
non-State protected land.
Actioned by other agency
This would normally be a local council.
Endangered
Ecological communities in New South Wales (all have reached
levels of <10% of pre-European extent in the last 20 years
·
White Box-Yellow Box-Red Gum woodland
·
Grey Box woodland
·
Coolibah - Black Box Woodland
·
Grassy Bull Oak woodland
Back to ecology action main index page